

A Guide to Testing and Debugging Node Applications is an excerpt from Manning’s Node.js in Action, Second Edition. Thoroughly revised in its second edition, this book guides you through all the features, techniques, and concepts you’ll need to build production-quality Node applications.
Functional Testing Node Applications
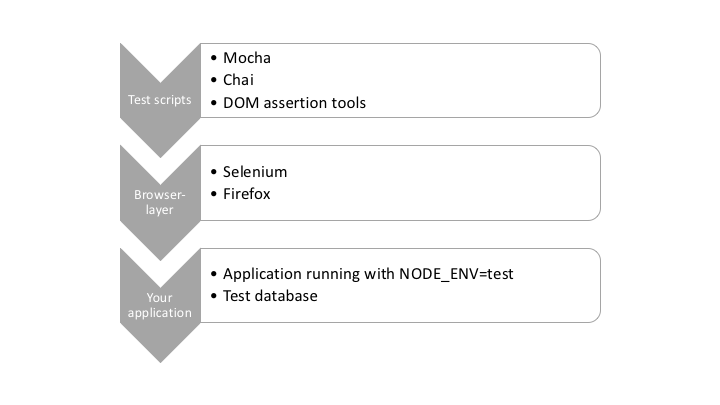
In most web development projects, functional tests work by driving the browser, then checking for various DOM transformations against a list of user-specific requirements. Imagine you’re building a content management system. A functional test for the image library upload feature uploads an image, checks that it gets added, and then checks that it’s added to a corresponding list of images.
The choice of tools for functional testing Node applications is bewildering. From a high level they fall into two broad groups: headless and browser-based tests. Headless tests typically use something like PhantomJS to provide a terminal-friendly browser environment, but lighter solutions use libraries such as Cheerio and JSDOM. Browser-based tests use a browser automation tool such as Selenium that allows you to write scripts that drive a real browser. Both approaches can use the same underlying Node test tools, and you can use Mocha, Jasmine, or even Cucumber to drive Selenium against your application.
Selenium
Selenium is a popular Java-based browser automation library which can be used for testing Node applications. With the aid of a language-specific driver, you can connect to a Selenium server and run tests against a real browser. In this article, you’ll learn how to use WebdriverIO, a Node Selenium driver.
Getting Selenium running is trickier than pure Node test libraries, because you need to install Java and download the Selenium JAR file. First, download Java for your operating system, and then go to the Selenium download site to download the JAR file. You can then run a Selenium server like this:
java -jar selenium-server-standalone-3.4.0.jar
Note that your exact Selenium version may be different. You may also have to supply a path to the browser binary. For example, in Windows 10 with Firefox set as the browserName, you can specify Firefox’s full path like this:
java -jar -Dwebdriver.firefox.driver="C:\path\to\firefox.exe" selenium-server-standalone-3.4.0.jar
Alternatively, you might need to download mozilla’s Gecko driver (placing it in the same folder as the selenium executable, and start it like so:
java -jar -Dwebdriver.gecko.driver=geckodriver selenium-server-standalone-3.4.0.jar
The exact path depends on how Firefox is installed on your machine. For more about the Firefox driver, read the SeleniumHQ documentation. You can find drivers for Chrome and Microsoft Edge that are configured in similar ways.
Now, with the Selenium server running, create a new Node project and install WebdriverIO:
mkdir -p selenium/test/specs
cd selenium
npm init -y
npm install --save-dev webdriverio
npm install --save express
WebdriverIO comes with a friendly config file generator. To run it, run wdio config:
./node_modules/.bin/wdio config
Follow the questions and accept the defaults. It should look something like this:
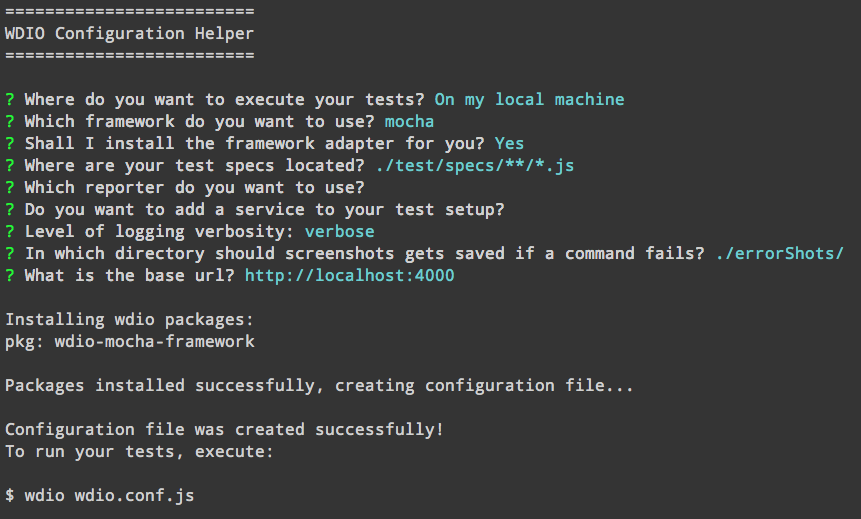
Update the package.json file with the wdio command to allow tests to be run with npm test:
"scripts": {
  "test": "wdio wdio.conf.js"
},
Now add something to the test. A basic Express server will suffice. The example is used in the subsequent listing for testing. Save this listing as index.js.
const express = require('express');
const app = express();
const port = process.env.PORT || 4000;

app.get('/', (req, res) => {
  res.send(`
<html>
  <head>
    <title>My to-do list</title>
  </head>
  <body>
    <h1>Welcome to my awesome to-do list</h1>
  </body>
</html>
  `);
});

app.listen(port, () => {
  console.log('Running on port', port);
});
The above snippet uses ES2015. If you’d like a refresher on this, check out SitePoint’s course, Diving into ES2015.
The good thing about WebdriverIO is that it provides a simple, fluent API for writing Selenium tests. The syntax is clear and easy to learn—you can even write tests with CSS selectors. The next listing (found in test/specs/todo-test.js ) shows a simple test that sets up a WebdriverIO client and then checks the title on the page.
const assert = require('assert');
const webdriverio = require('webdriverio');

describe('todo tests', () => {
  let client;

  before(() => {
    client = webdriverio.remote();
    return client.init();
  });

  it('todo list test', () => {
    return client
      .url('http://localhost:4000')
      .getTitle()
      .then(title => assert.equal(title, 'My to-do list'));
  });
});
After WebdriverIO is connected, you can use an instance of the client to fetch pages from your app. Then you can query the current state of the document in the browser—this example uses getTitle to get the title element from the document’s head. If you want to query the document for CSS elements, you can use .elements instead. Several kinds of methods for manipulating the document, forms, and even cookies exist.
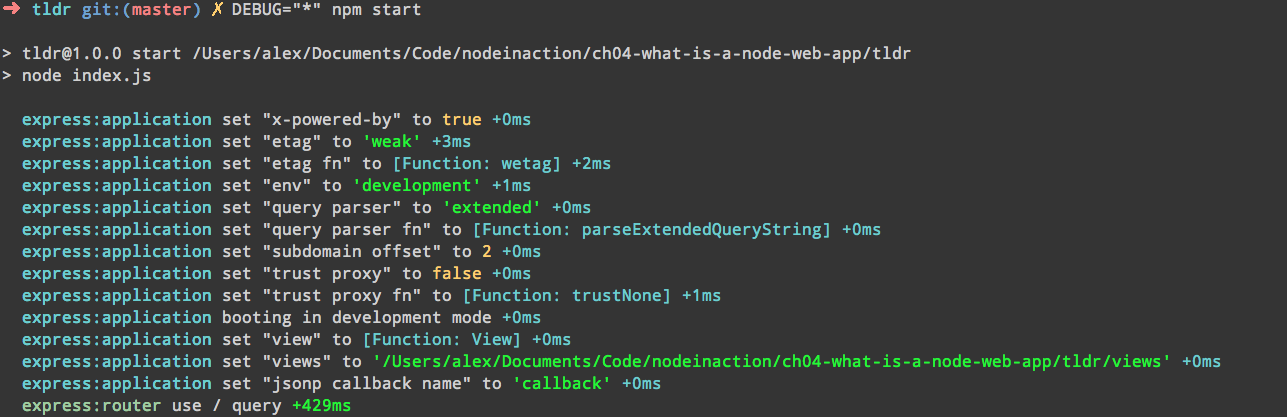
This test can run a real browser against a Node web app. To run it, start the server on port 4000:
PORT=4000 node index.js
Then type npm test. You should see Firefox open and the tests run in the command-line. If you want to use Chrome, open wdio.conf.js and change the browserName property.
More-advanced testing with Selenium
If you use WebdriverIO and Selenium to test a more complex web app that uses something like React or Angular, you’ll want to check out the utility methods. Some of the methods pause the test until certain elements are available, which is great for React apps that may asynchronously render the document, updating it several times based on when remote data’s available. Look at the waitFor* methods, such as waitForVisible to learn more.
If you’d like to learn more about this kind of testing, check out JavaScript Functional Testing with Nightwatch.js
Dealing with Failing Tests
When you’re working on an established project, there’ll come a point when tests begin to fail. Node provides several tools for getting more detail on failed tests. Let’s talk about how to enrich the output generated when debugging failing tests.
The first thing to do when tests fail is to generate more-verbose logging output. The next section demonstrates how to do that with NODE_DEBUG.
Getting more-detailed logs
When tests fail, it’s useful to get information on what the program is doing. Node has two ways to do this: one for Node’s internals, and another for npm modules. To debug Node’s core modules, use NODE_DEBUG.
Using NODE_DEBUG
To see how NODE_DEBUG works, imagine you’ve a deeply nested filesystem call where you’ve forgotten to use a callback. For example, the following example throws an exception:
const fs = require('fs');

function deeplyNested() {
fs.readFile('/');
}

deeplyNested();
The stack trace shows only a limited amount of detail about the exception, and it doesn’t include full information on the call site where the exception originated:
fs.js:60
    throw err;  // Forgot a callback but don't know where? Use NODE_DEBUG=fs
      ^

Error: EISDIR: illegal operation on a directory, read
    at Error (native)
Without the helpful comment, many programmers see a trace like this and blame Node for the unhelpful error. But, as the comment points out, NODE_DEBUG=fs can be used to get more information on the fs module. Run the script like this instead:
NODE_DEBUG=fs node node-debug-example.js
Now you’ll see a more detailed trace that helps debug the issue:
fs.js:53
    throw backtrace;
        ^

Error: EISDIR: illegal operation on a directory, read
    at rethrow (fs.js:48:21)
    at maybeCallback (fs.js:66:42)
    at Object.fs.readFile (fs.js:227:18)
    at deeplyNested (node-debug-example.js:4:6)
    at Object.<anonymous> (node-debug-example.js:7:1)
    at Module._compile (module.js:435:26)
    at Object.Module._extensions..js (module.js:442:10)
    at Module.load (module.js:356:32)
    at Function.Module._load (module.js:311:12)
    at Function.Module.runMain (module.js:467:10)
It’s clear from this trace that the problem lies in our file, inside a function on line 4 that was originally called from line 7. This makes debugging any code that uses core modules much easier, and it includes both the filesystem and network libraries such as Node’s HTTP client and server modules.
Using DEBUG
The public alternative to NODE_DEBUG is DEBUG. Many packages on npm look for the DEBUG environment variable. It mimics the parameter style used by NODE_DEBUG, allowing you to specify a list of modules to debug or see all of them with DEBUG='*'.
If you want to incorporate the NODE_DEBUG functionality into your own projects, use the built-in util.debuglog method.
const debuglog = require('util').debuglog('example');
debuglog('You can only see these messages by setting NODE_DEBUG=example!');
To make custom debug loggers that are configured with DEBUG, you need to use the debug package from npm](https://www.npmjs.com/package/debug). You can create as many loggers as you want. Imagine you’re building an MVC web application. You could create separate loggers for models, views, and controllers. Then, when tests fail, you’ll be able to specify the debug logs that are necessary to debug the specific part of the application. The following listing demonstrates how to use the debug module.
const debugViews = require('debug')('debug-example:views');
const debugModels = require('debug')('debug-example:models');

debugViews('Example view message');
debugModels('Example model message');
To run this example and see the view logs, set DEBUG to debug-example:views, like soDEBUG=debug-example:views node index.js
One final feature of debug logging is that you can prefix a debug section with a hyphen to remove it from logs:
DEBUG='* -debug-example:views' node index.js
Hiding certain modules means you can still use the wildcard, but omit unneeded or noisy sections from the output.
Getting Better Stack Traces
If you’re using asynchronous operations, and that includes anything you’ve written using asynchronous callbacks or promises, then you may run into problems when stack traces aren’t detailed enough. Packages on npm can help you in such cases. For example, when callbacks run asynchronously, Node won’t keep the call stack from when the operation was queued. To test this, create two files, one called async.js that defines an asynchronous function, and another called index.js that requires async.js.
This snippet is called aync.js:
module.exports = () => {
  setTimeout(() => {
    throw new Error();
  })
};
And index.js needs to require async.js:
require('./async.js')();
Now if you run index.js with node index.js you’ll get a short stack trace that doesn’t show the caller of the failed function, only the location of the thrown exception:
throw new Error();
    ^

Error
    at null._onTimeout (async.js:3:11)
    at Timer.listOnTimeout (timers.js:92:15)
To improve this reporting, install the trace package and run it with node -r trace index.js. The -r flag tells Node to require the trace module before loading anything else.
Another problem with stack traces is they can be too detailed. This happens when the trace includes too much detail about Node’s internals. To clear up your stack traces, use clarify. Again, you can run it with the -r flag:
$ node -r clarify index.js
    throw new Error();
    ^

Error
    at null._onTimeout (async.js:3:11)
Clarify is particularly useful if you want to include stack traces in error alert emails for a web application.
If you’re running code intended for browsers in Node, perhaps as part of an isomorphic web application, then you can get better stack traces by using source-map-support. This can be run with -r, but it also works with some test frameworks:
node -r source-map-support/register index.js
mocha --require source-map-support/register index.js
The next time you’re struggling with a stack trace generated by asynchronous code, look for tools such as trace and clarify to make sure you’re getting the best out of what V8 and Node can offer.
Summary
So there you have it. In this article we’ve looked at functional testing Node applications using Selenium, as well as some tips and tricks for dealing with failing tests. If you enjoyed this article, you can visit the book’s homepage and download the free first chapter of Node.js in Action, Second Edition or purchase the entire book.
Frequently Asked Questions (FAQs) about Testing Node Applications
What are the best practices for testing Node.js applications?
Testing is a crucial part of any application development process. For Node.js applications, it’s recommended to follow certain best practices. Firstly, always write unit tests for your functions to ensure they work as expected in isolation. Secondly, integration tests are important to check if different parts of your application work together correctly. Thirdly, end-to-end tests can help you understand how your application behaves in real-world scenarios. Tools like Mocha, Chai, and Jest can be used for writing these tests. Also, consider using a continuous integration (CI) system to automatically run your tests whenever changes are made to the codebase.
How can I debug my Node.js application?
Debugging is an essential skill for any developer. For Node.js, you can use the built-in debugger by starting the application with the node debug command. You can also use external tools like Node Inspector or Visual Studio Code’s debugging features. These tools allow you to set breakpoints, step through your code, and inspect variables. Remember to write meaningful log statements in your application, which can be invaluable when trying to understand unexpected behavior.
What are some common issues I might encounter when testing Node.js applications?
When testing Node.js applications, you might encounter issues related to asynchronous code, callback hell, and unhandled promise rejections. These can make your tests flaky and unreliable. To overcome these issues, make sure to properly handle asynchronous operations in your tests. You can use async/await syntax to make your code easier to read and understand. Also, consider using a linter like ESLint to catch common mistakes before they become problems.
How can I enable core debug logs in Node.js?
Core debug logs can be enabled in Node.js by setting the NODE_DEBUG environment variable. This can be done by running your application with the command NODE_DEBUG=module_name node your_script.js. Replace module_name with the name of the core module you want to debug, like http or net. The debug logs will then be printed to the console. This can be very useful for understanding what’s happening under the hood of your application.
How can I test my Node.js application’s performance?
Performance testing is important to ensure your Node.js application can handle high loads. You can use tools like Apache JMeter or Artillery to simulate multiple users accessing your application at the same time. These tools can provide useful metrics like response time and throughput. Also, consider using a profiling tool like Node Clinic to identify performance bottlenecks in your code.
How can I write testable code in Node.js?
Writing testable code involves designing your functions and modules in a way that makes them easy to test. This often involves following principles like single responsibility and loose coupling. Make sure each function does one thing and does it well. Avoid global state and prefer to pass dependencies as arguments to your functions. This makes it easier to replace them with mocks or stubs in your tests.
How can I handle errors in my Node.js tests?
Error handling is a crucial part of writing robust tests. In Node.js, you can use the try/catch syntax to catch errors and handle them appropriately. Make sure to also handle promise rejections by adding a .catch() clause to your promises. In your tests, you can use the assert.throws() function to check if a function throws an expected error.
How can I test my Node.js application’s database interactions?
Testing database interactions can be challenging, but it’s important to ensure your application works correctly with the database. You can use an in-memory database like SQLite for testing, which is faster and easier to set up than a real database. Also, consider using a library like Sequelize or Mongoose, which provide a high-level API for interacting with the database and make your code easier to test.
How can I test my Node.js application’s user interface?
Testing the user interface of your Node.js application can be done using end-to-end testing tools like Puppeteer or Cypress. These tools allow you to automate browser actions like clicking buttons and filling out forms. They can also take screenshots and record videos of your tests, which can be useful for debugging.
How can I ensure my Node.js tests are reliable and repeatable?
To ensure your tests are reliable and repeatable, make sure to clean up after each test. This might involve resetting the database to a known state or clearing any changes made to the file system. Also, avoid relying on external services in your tests, as they can make your tests slow and flaky. Instead, consider using mocks or stubs to simulate these services.