
Measuring developers' work is different from traditional roles since every new feature, bugfix, or refactor is not the same and has different levels of complexity. This article goes through some older and then better ways of measuring developer productivity.
Developer’s Persona
The role largely revolves around problem-solving where the solution is not always in plain sight with the additional burden of maintaining the existing framework. Unless the problem is a repeat from prior experiences, developers will need a distraction-free environment to work through it.
Now there are different kinds of developers but if we’re talking about one whose job is to add new features, fix bugs, and participate in architecture decisions, then the persona above fits well. Either way, developers work in a flow state, and interruptions affect productivity.
The Old Way
JIRA Tickets
Some orgs rely on JIRA as their task manager where requested features and bugs are put in as tickets. The one who closes the most tickets in a timeframe is surely the most productive one right?
Maybe, maybe not. These tickets completely ignore the complexity of each item, so treating them as equal creates a wrong perception. People dealing with easier tickets would top the charts, while the rest are slumping through the harder ones.
But just like we add priorities to tickets, maybe we could estimate complexity too? This does add more observability, but estimates from non-engineers will be wrong more times than not.
Something like adding a “simple dropdown” could turn into something major if it conflicts with the current setup or demands resolution of previous tech debt to proceed further. You could maybe have an engineer write accurate tickets, but that would be wasting precious developer time. Resolution of JIRA or tickets of any sort isn’t a good indicator in the end.
Story Points
Story points are a measure of time to develop a feature relative to other features. Estimation in software development is one of the hardest things and story points could’ve been great but they just made things worse.
Many companies today use these as a measure of productivity, and teams are judged on how many points they did in the current sprint and God forbid if it was lower than the last one. This effectively promotes gaming the system and giving longer estimates defeating the purpose.
Progress Meetings
In principle, it seems like a good idea for a manager to ask how you are doing and if you have any blockers but in reality, regular progress meetings are really good at wasting everyone’s time and turn the focus from actual work to meetings themselves.
Oftentimes, the result of one meeting is a follow-up meeting so we’re eventually running in a loop with no end in sight. It doesn’t help that meeting anxiety is a common thing where people are unable to focus on work until the said meeting is done.
The New Way
Measuring productivity in engineering has always been challenging, but years of research and surveys have developed metrics that can provide valuable insights into your team’s performance and help identify hidden blockers and signs of burnout. These are called DORA metrics (see under Software Delivery) and were developed by Google’s DevOps Research and Assessment team.
Software delivery is measured by essentially four key metrics:
- Change Lead Time: How fast are we moving?
- Deployment frequency: How often are we pushing to production?
- Change fail percentage: How reliable are our deployments?
- Failed deployment recovery time: How fast do we recover?
These metrics give instant observability of your team at a glance and contain various sub-metrics for deep dives if needed. The DORA team does a yearly report to keep up with how the industry is using these metrics, their averages, impact, and more. 2025 is the latest version but it does focus on AI-assisted development a lot. You can check the 2021 version to get a scoop of traditional development instead.
Measuring DORA metrics and more
In tight orgs with a small set of developers, it’s not necessary to use tools to measure your team’s productivity but as your team grows, so do the things to keep track of. This is where you can utilize observability tools that measure DORA metrics, such as Swarmia, LinearB, and Codemetrics.
I’ll especially mention Codemetrics here since it has the cheapest per-seat pricing, along with the fact that I was involved with it for some time at the start. (full disclosure)
The hardest step and decision is to give some view permissions to select part of your code’s repository, but these tools use metadata from pull requests to calculate all stats so your code remains unseen and safe.
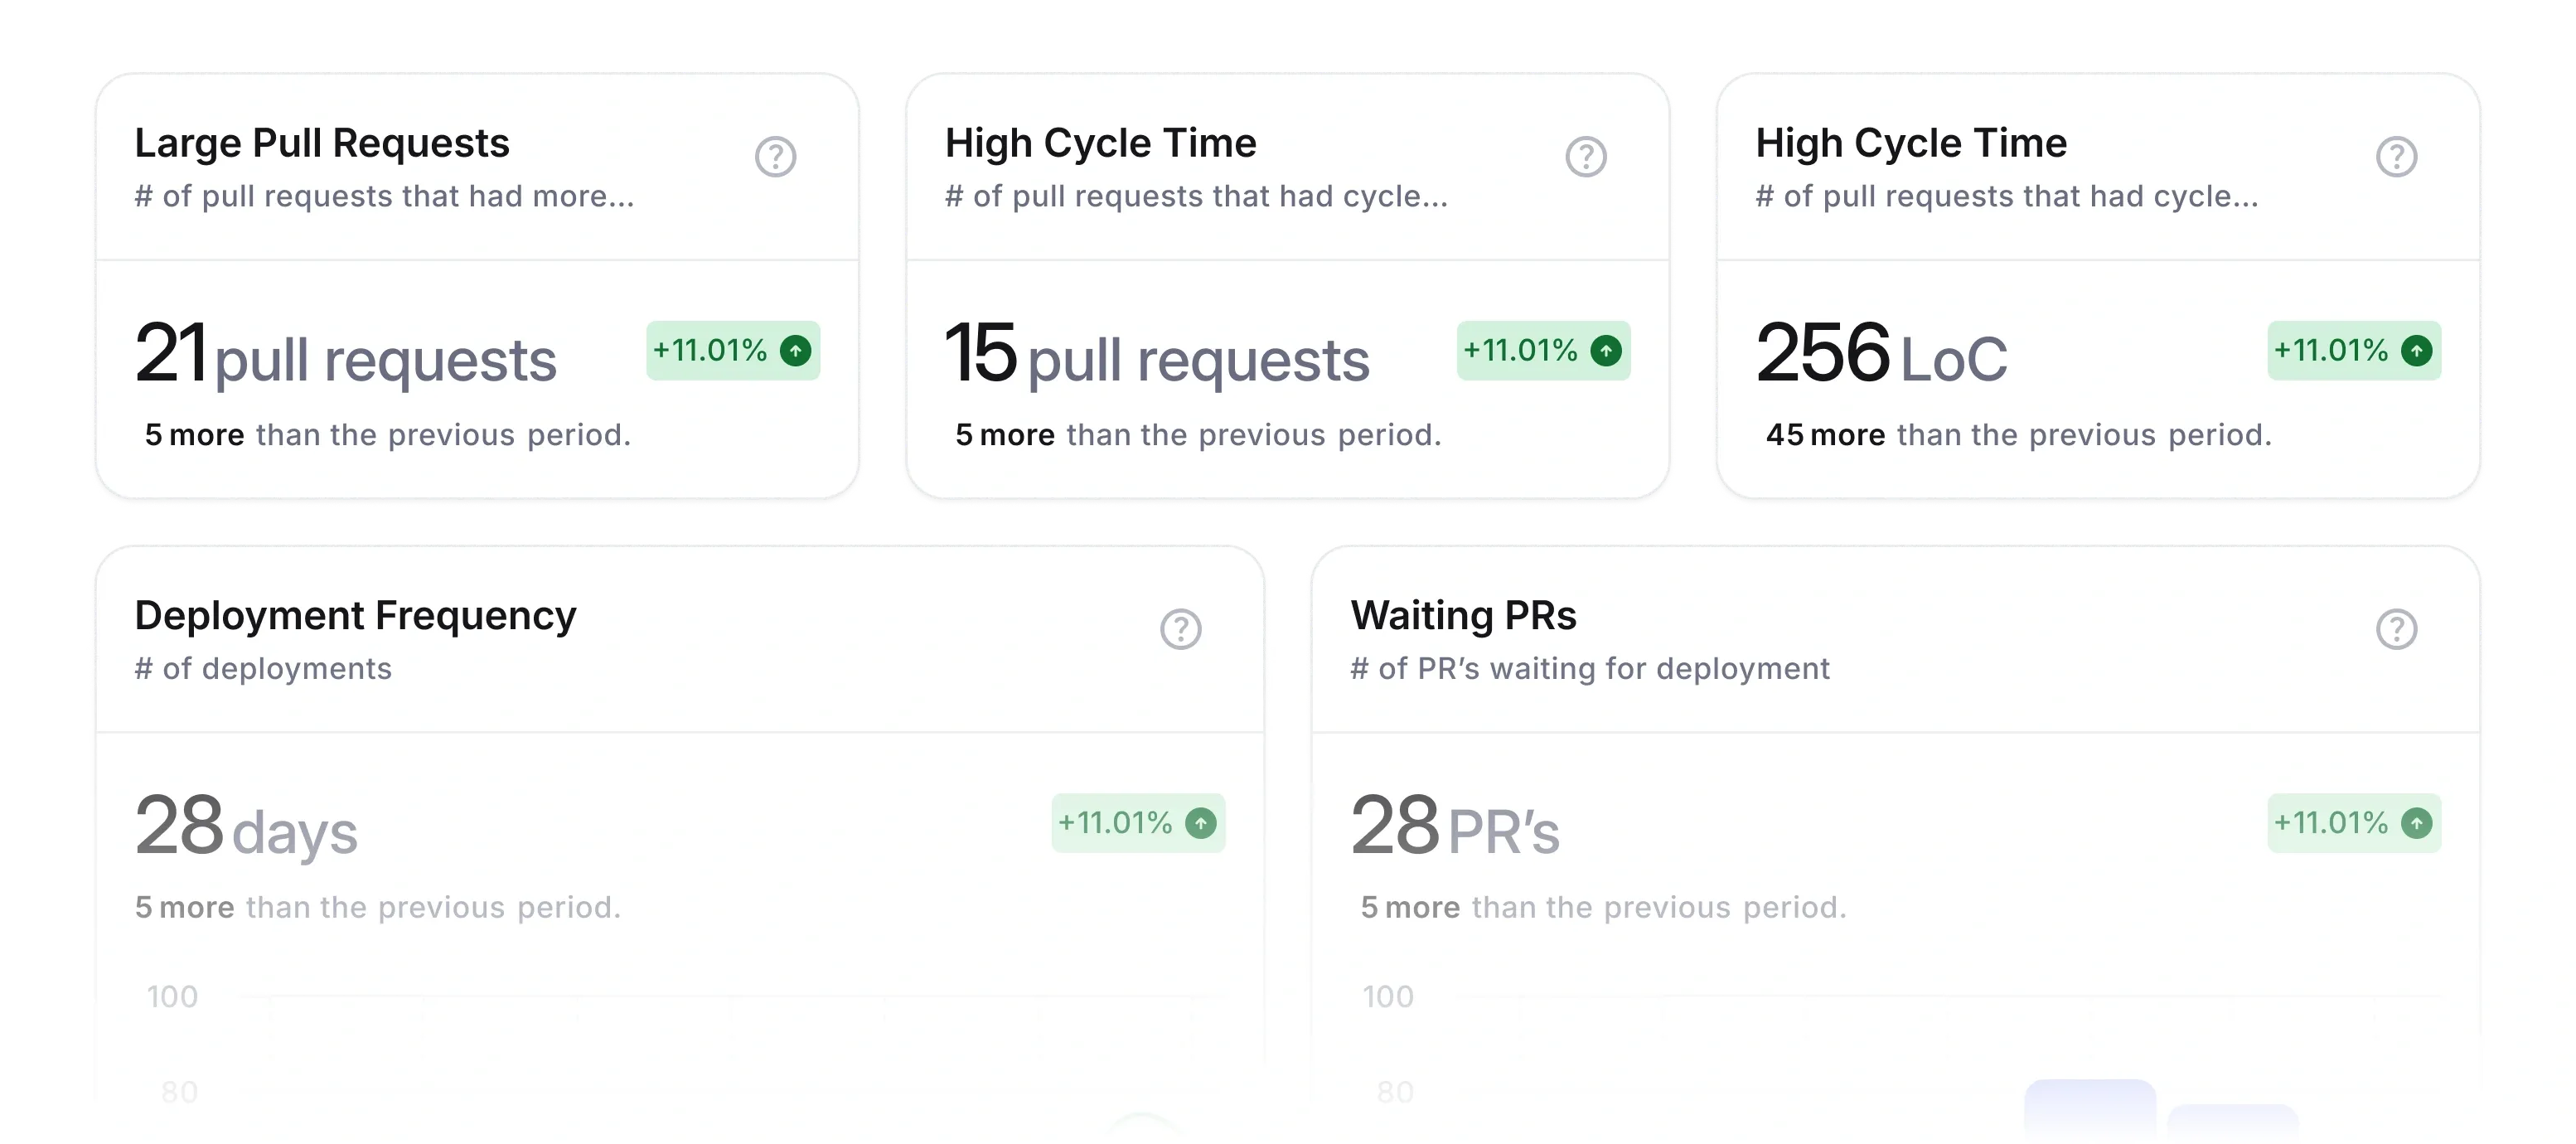
You can also edit and arrange what kind of metrics you want to track to ensure you’ve the view that’s working for you. Besides tracking DORA metrics, Codemetrics also has additional goodies, although anything to do with source code will require access to it for analysis, but these are opt-out by default.
- AI Engineering Manager - Team insights by AI
- Daily Team Insights - Slack & Email Reports
- DORA Metrics & Benchmarks - Reports trusted by leaders
- Code Quality & Bug Detection - Catch bugs and code issues early
- Developer Badges & Gamification - Celebrate developer wins
- Team Activity Feed - Every commit tells a story
- Developer Leaderboard - Acknowledge your coding champions
- AI Code Reviews - Instant feedback on PRs
- AI Commit Summaries - Clear, concise code summaries
If you haven’t tried these kinds of tools before, then it’d be a good idea to see if they suit your business needs. They always come with a demo or free trial too so you only stick with it if it works out.