
You want to add an interactive, customizable map to your website.
While Google Maps might be the leader of the pack when it comes to personal mapping and route planning, it’s not always the best solution for other purposes.
There are a number of reasons why WordPress developers seek out alternatives to the Google Maps API. Loading speeds, privacy concerns, UI customization, and missing features are all valid concerns and objections.
So, what should you use instead?
Keep reading to learn more about SVG as an alternative to Google Maps and how one plugin will help you create the interactive map you envisioned.
Without compromises.
Why You Need a Google Maps Alternative
It’s not as though you can’t create custom, interactive maps with Google Maps.
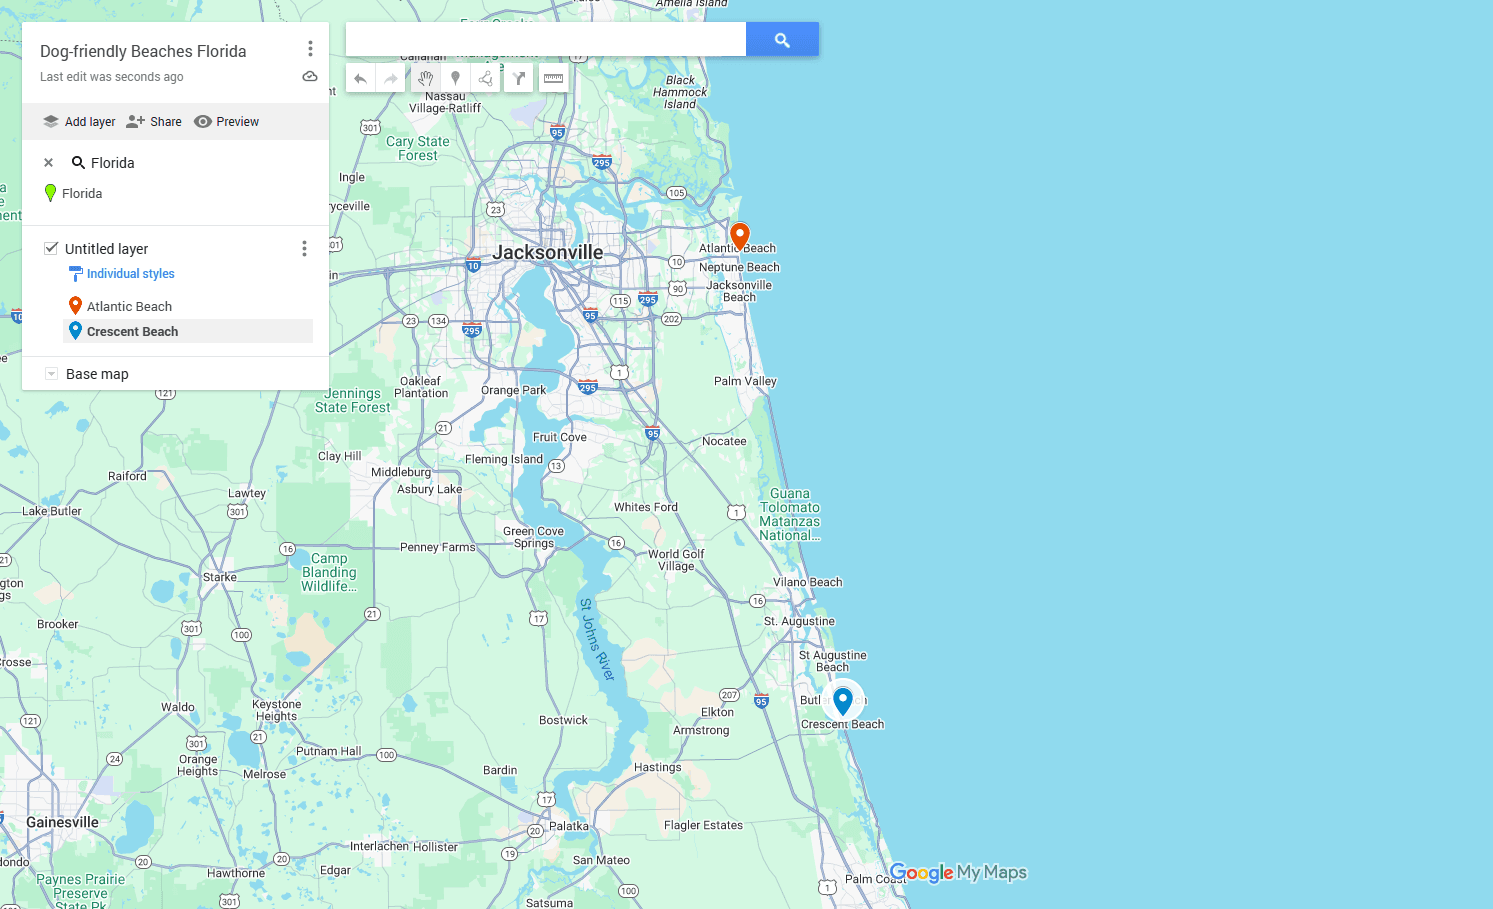
For example, let’s say you wanted to make a map of Florida’s best dog-friendly beaches to embed on your website.
With Google Maps, you can select the location you want to target, add layers, pin markers, and add some custom details (like location descriptions and marker colors).
This is fine, if that’s all you need.
But what if you envisioned something more for your geographical map?
Or what if you wanted to create a different kind of map altogether?
Let’s start there – with map types. Here are some location and content types that Google won’t be able to help you map:
- Agent locator map (like in real estate or insurance)
- Building layout map
- Store department map
- Campus map
- Mall directory
- Event or conference layout
- Apartment floor plan
- Private location map (e.g. amusement parks, regional parks, museums)
- Data visualization map
- Blog post graphic with pinned recommendations and locations
And here are some other reasons why developers and designers often seek out alternatives to Google for creating custom maps:
- They want the map to match the brand, not Google’s.
- The feature or functionality needed isn’t available.
- They have custom data to generate the map and points of interest from.
- Google Maps has too much information and can be distracting.
- They want to make regions clickable in addition to markers.
- They’re nervous about giving Google access to all location and business data.
- The Google Maps API slows down pages too much.
- They want something that integrates seamlessly with WordPress.
If this sounds like the situation you’re in, MapSVG could be the alternative you’ve been looking for. With this WordPress plugin, you can create any type of map you like using an SVG file and your own data. Then customize it to your liking.
How to Create a Custom, Interactive Map with MapSVG
MapSVG gives you as much flexibility and control as you want over your website maps. With extensive customization settings as well as JavaScript and CSS editors, you can make your vision a reality with this WordPress plugin.
Here’s a look inside the plugin and how you’ll use it to piece together your next map:
Note (updated): MapSVG includes its own database with custom fields for Regions and Markers. You can add and manage those fields directly in MapSVG.
If you prefer to keep data in WordPress posts/CPTs, you can optionally use ACF to manage those fields and connect them to MapSVG. ACF is not required.
Step 1: Add Your SVG Graphic
After installing the MapSVG plugin and activating your license, hop over to the plugin’s dashboard. Here you’ll have the option of creating your map from dozens of geographic templates or by importing your own.
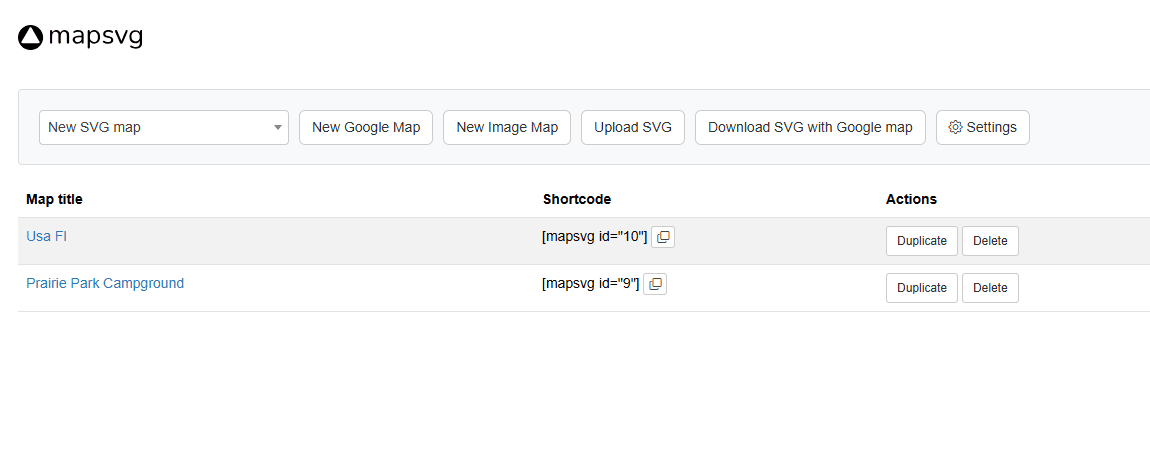
Click the dropdown that says “New SVG map” to choose from over a hundred maps for the world, continents, countries, as well as individual U.S. states.
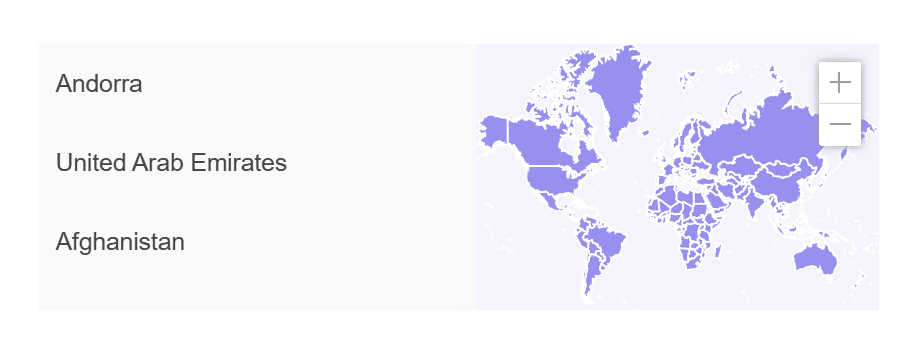
For example, this is the map of the world:
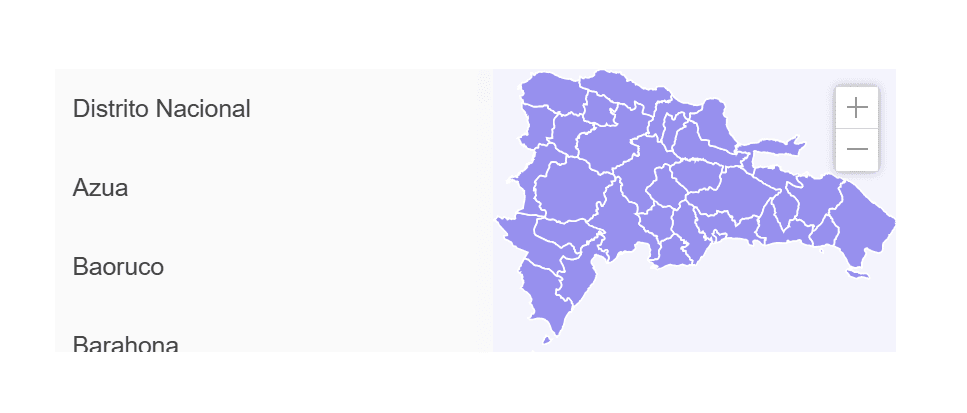
This is the map of the Dominican Republic:
And this is the map of the state of Minnesota:

See the full list of maps here.
If you’d prefer to use your own map or graphic, select “Upload SVG”. There are no limits on what you can upload.
That said, the MapSVG plugin can save you time in mapping regions, creating objects, and adding markers if you set the SVG file up a certain way. Specifically, the plugin will parse the available graphics, looking for the following in the SVG file:
- The object has a set ID
- The object is a path / rect / polygon / ellipse / circle
If these characteristics are met, the plugin will automatically map those objects as Regions for you.
Step 2: Customize the Look of Your Map
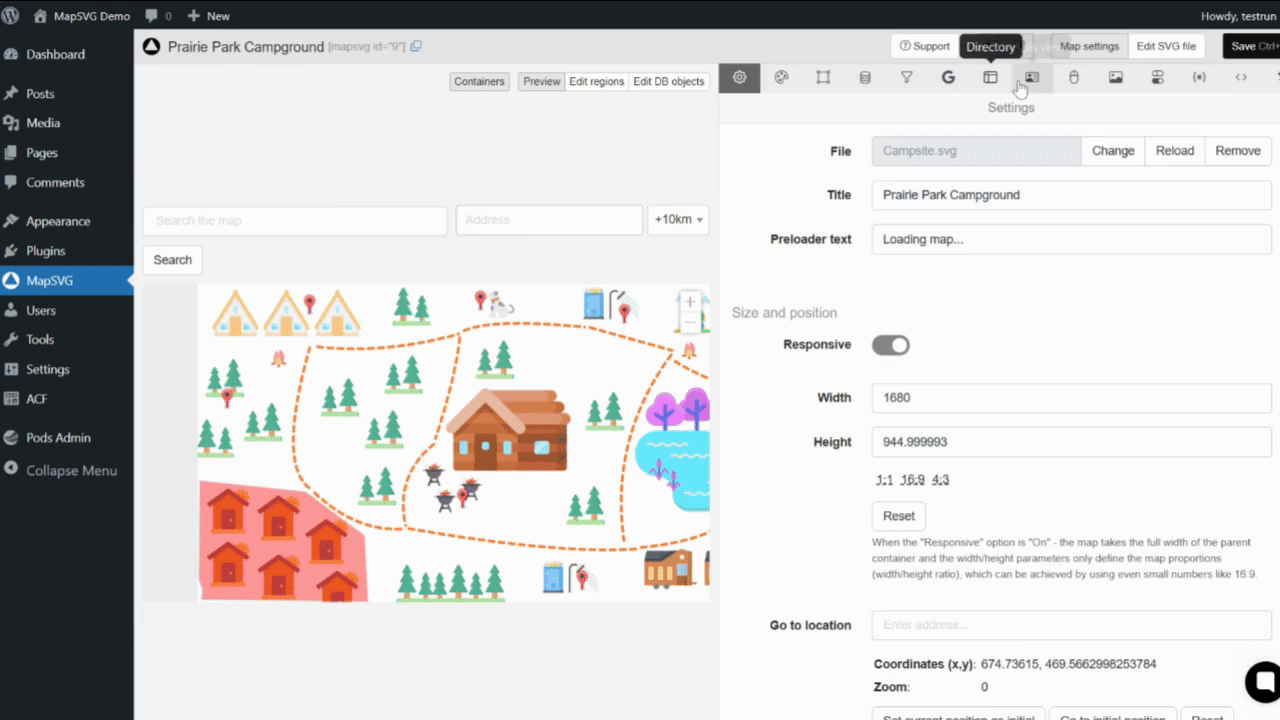
With your map loaded, the MapSVG editor will look like this:

On the left is the SVG file you imported. In this case, it’s an illustrated map of Prairie Park campground to help visitors get around.
On the right is the settings panel. The icons along the toolbar at the top enable you to customize various aspects of your map along with the various regions, objects, or locations found within it.
The first two icons – Settings and Colors – are where you’ll do most of the initial configuration. You can set zoom and scroll controls, configure how tooltips and popovers appear, add labels to markers, and so on. You can also customize the colors within the map.
If there’s further styling and customization you want to do, use the JavaScript and CSS icons at the end of the toolbar to make your adjustments.
Step 3: Add or Import Your Data
There are two kinds of interactive content to add to your map.
Regions are larger containers that divide up the map. For instance, on a map of the U.S., Regions would most likely be the 50 states. That said, you could also divide it up by region, like Northeast, Southwest, and so on. For a store map, on the other hand, Regions could be departments (e.g. “Mens”, “Shoes”, “Home Goods”).
Not every map has to have Regions. If all you want to do is add markers with relevant information, you can set your map up with Objects only.
Objects can be anything you want them to be. In the campground map example, for instance, Objects are all the key locations around the park, including:
- Cabins
- Tent campground
- Restroom facilities
- Fire pits
- Dog park
If you’ve created an SVG file where the plugin can’t clearly identify where your Regions and Objects are, though, you’ll need to manually create them. There are a number of ways to accomplish this.
Using the Editor to Add Regions
To manually add a Region to your map, click the Edit SVG file button in the top toolbar. The map will remain where it is, but a small toolbar will appear along the left side of the screen with drawing tools.
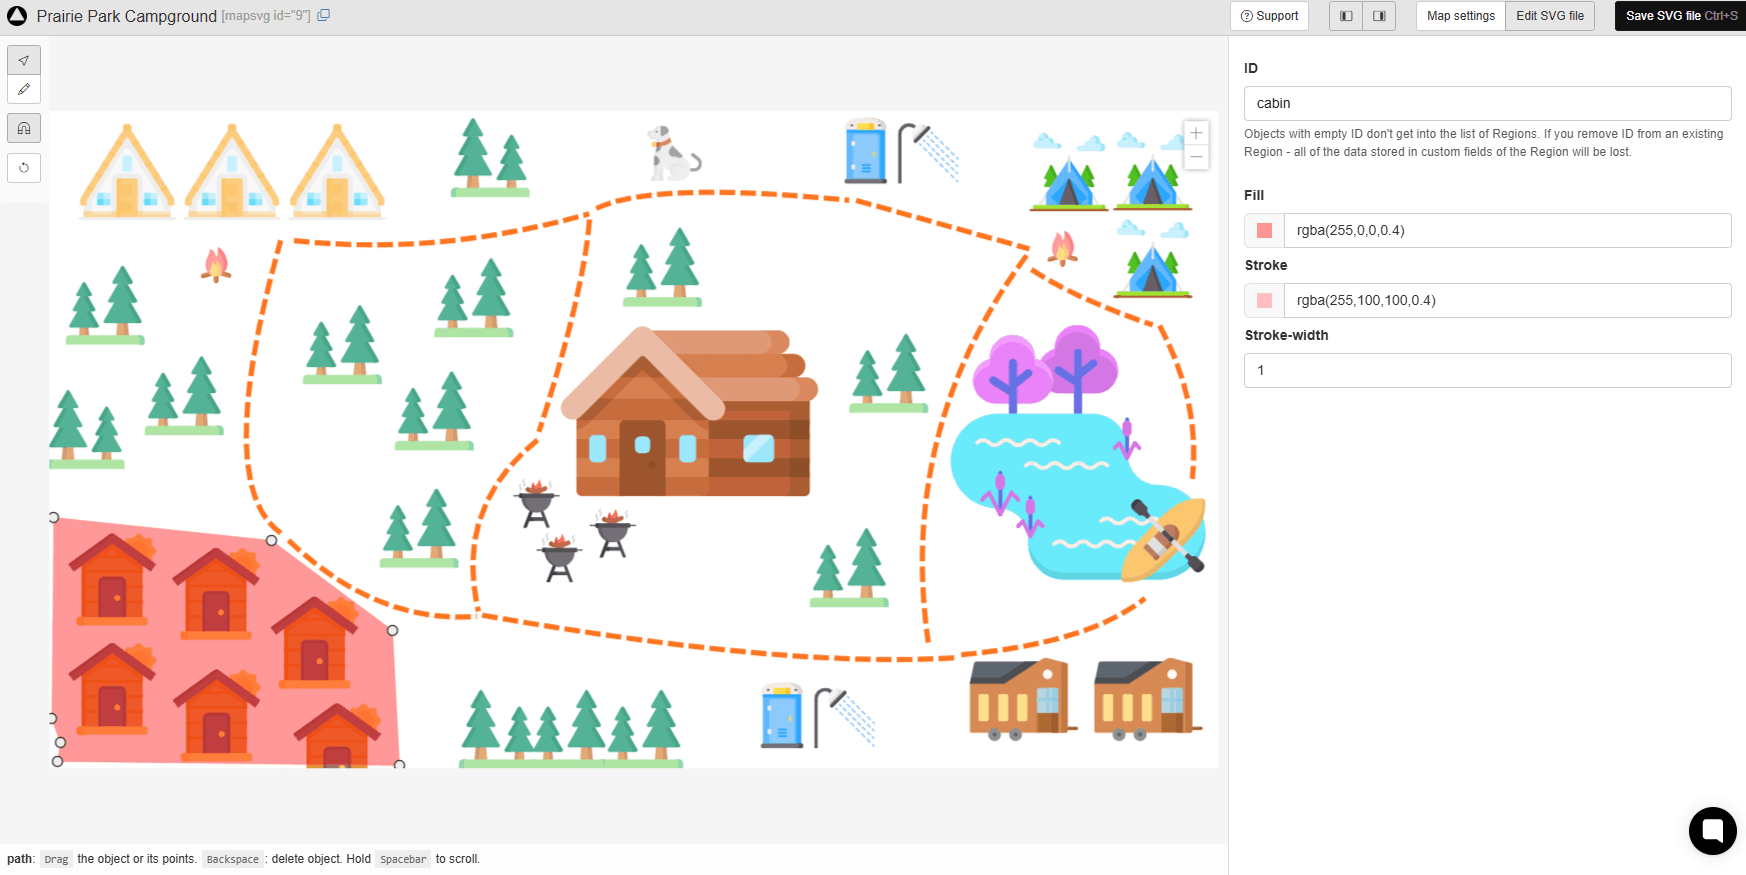
Using these tools, you can select objects (like the dog or tree graphics). You can also draw geometric shapes to set various Regions. Once you’ve selected or added a Region, double-click on it and give it a descriptive ID. You can also customize the fill color.
Once your Regions are saved in the file, you’ll be able to see them when you go to Map Settings > Regions.
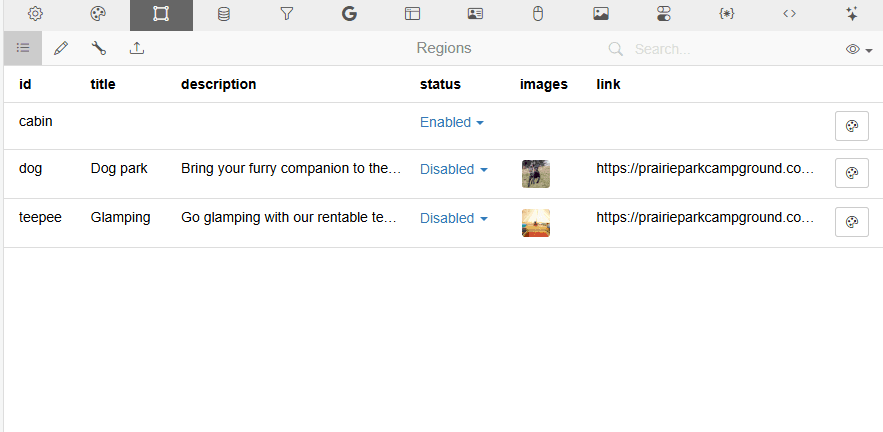
The new “cabin” Region I created in the screenshot above has been added to my list. But it’s missing important details. To fill these in, click on the Region you want to edit.
By default, MapSVG will let you fill in the following fields:
- ID
- Title
- Description
- Status
- Images (to upload)
- Link
If you want to modify what information you can attach to each Region, click the Edit Fields button (the pencil icon) above the settings panel.
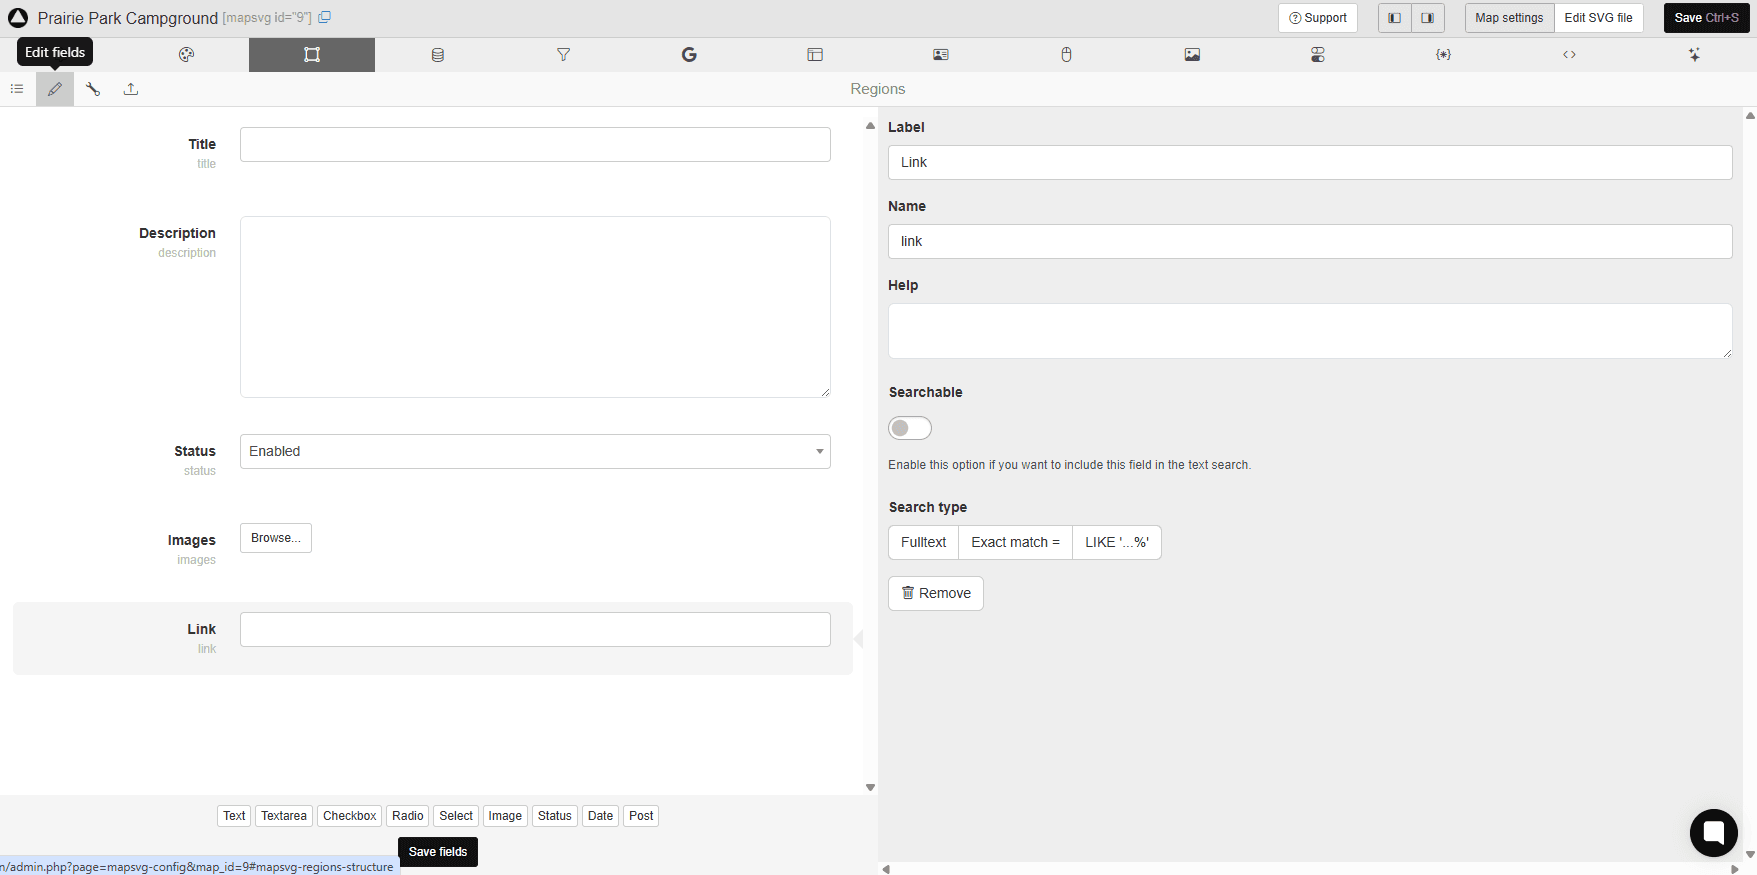
What you see on the left are all the fields you can fill in. On the right is where you customize the parameters for each field.
To remove a field, select it from the left side and then hit the “Remove” button on the right.
To add a field, select one of the buttons at the bottom – e.g. Text, Textarea, Checkbox, Radio, etc. Then configure the settings as needed.
MapSVG’s built-in database lets you add/edit custom fields for Regions and Objects directly.
If your workflow uses WP posts/CPTs with ACF, you can connect those too—ACF is optional, not a requirement.
Once you’re done, save your changes and return to your list.
Importing a CSV File of Your Objects
To add Objects (and corresponding markers) to your map, you’ll need to import a CSV file. (You can do the same with Regions, by the way.)
In order to import your CSV, the fields must match the fields in the plugin. To see what they currently are, go to Database > Edit fields. Same as with Regions, if you want to customize the fields attached to each Object, add, edit, or remove them here.
Once you have your spreadsheet mapped to the fields in MapSVG, enter all the relevant info you can. At the very least, include an ID and Title. You can fill in the rest of the details later inside the plugin.
Here’s what my Objects import file looks like in Google Sheets:
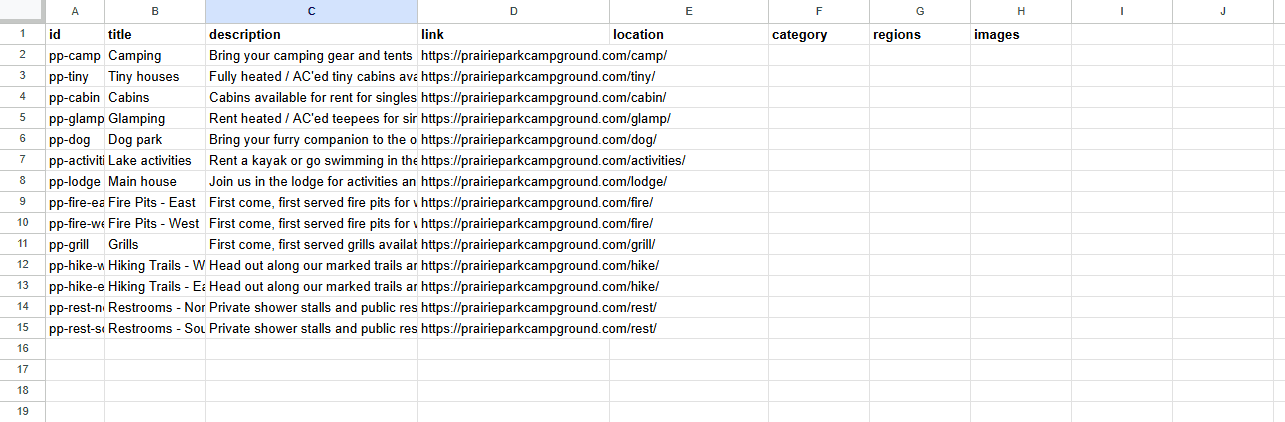
To download this sample and use it yourself:
- Open this document in your browser.
- Go to File > Make a copy and save it to your Google Drive.
- Alternatively, click on File > Download and save it as a Comma Separated Values (.csv) file to your computer.
You’ll find sample Regions and Objects sheets in the document. You’ll need to export them separately if you plan to use both.
When you have your CSV file ready, click the Import button from the Database view (if importing Objects). Select the file and upload it.
When it’s done, go to the List view and you’ll find all your Objects have been added.
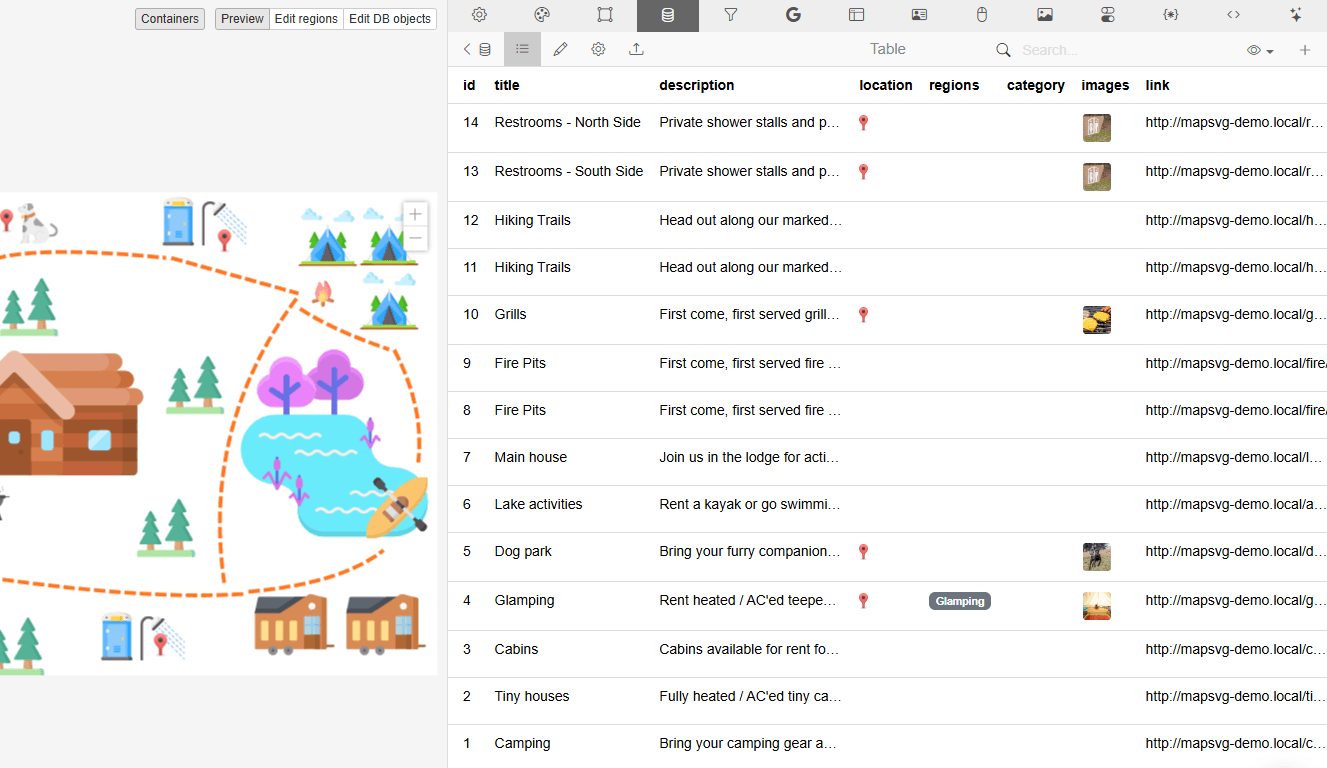
To fill in details and add images, click on the Object name and edit it.
If you want to add Markers (red location pins), you can do so from this panel as well.
Select the Object you want to pin on the right side. With the editing pane open, click the map on the left where you want to drop the pin. Alternatively, you can enter an address or coordinates to map your marker.
While Regions are inherently interactive (based on the settings you enable in the next step), Objects are not. So you need to add Markers to them in order for visitors to interact with them.
Step 4: Bring Your Map to Life
Different kinds of maps need different interactivity.
Reveal Details
Start by going to the Actions tab in the top toolbar. From this screen, you get to dictate what happens when a user interacts with your map.
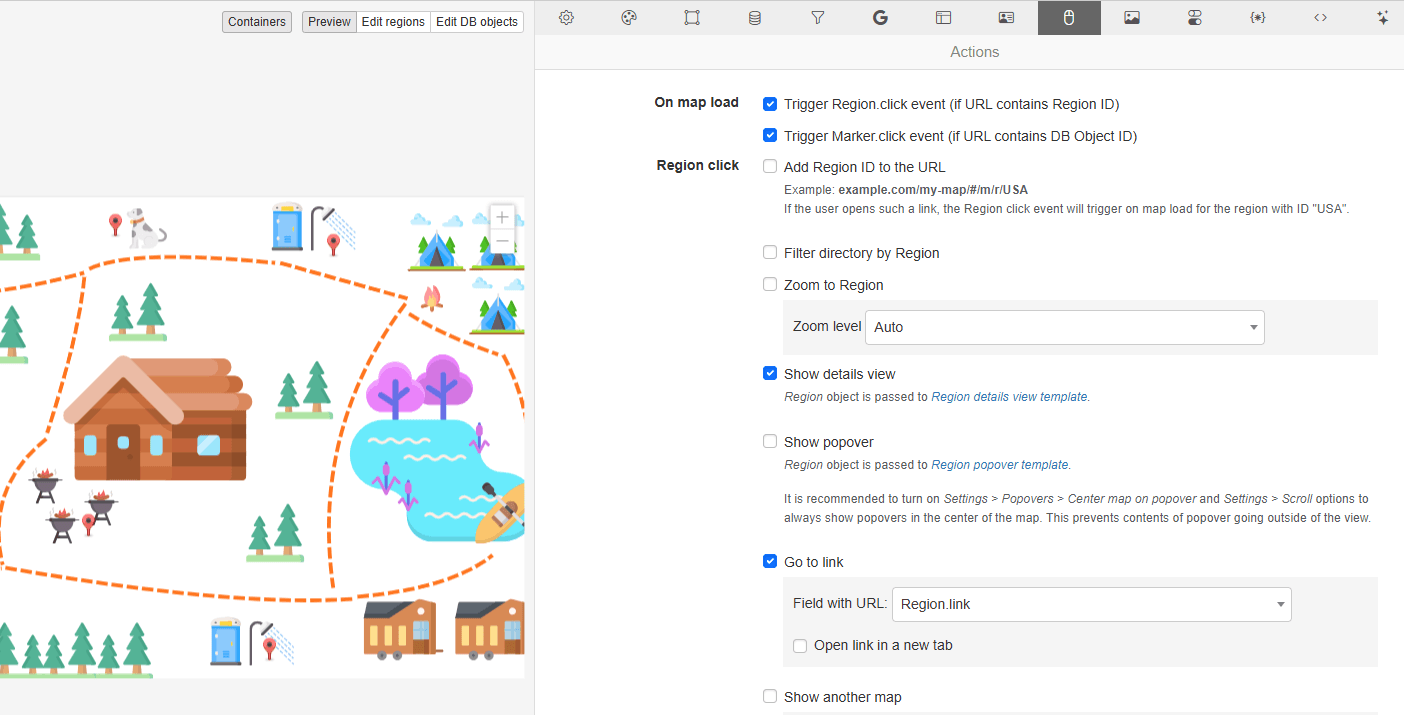
For example, when someone clicks on a Region or a Marker, you can set the map to:
- Zoom to that region.
- Share related details.
- Show a popover.
- Direct them to a linked page.
- Show a different map.
- Display a tooltip.
You can also do this for directory items.
Also, review the settings under the Details panel. From here, you can determine how Region or Object details appear. The options are:
- Map container
- Fullscreen
- Left sidebar
- Right sidebar
- Header
- Footer
- Custom container
If you’re adding lots of details and even photos about a location, object, or person, it’s a good idea to keep the map interface clear and to present the details off to the side. By presenting the details in a container outside of the map, this will enable you to create abetter organized and more user-friendly experience.
Include Filters, Search, and Directories
A map with lots of Regions and Markers may overwhelm some visitors. While some may be fun to engage with – like a choropleth map or other data visualization – others might need a more straightforward approach to interaction.
For example, let’s say you have a map containing all the insurance agent offices in your county. The insurance agents have each been assigned categories types based on what they sell: Health, Auto, Life, Liability, and so on.
Rather than make your visitors click each marker and dig into each agent’s details to get this info, you can enable filters and search from under the Filters tab.
Just like with Regions, you can customize which fields appear in your Filters bar. By default, “Category” and “Search by address” will appear.
Select either and click “Remove” to delete them. Then use the tabs at the bottom to add any fields you do need.
When using filters with an imported SVG graphic, your best bet when it comes to filters are text search, search by address, location search, and sorting by ACF field or taxonomy (if you’re using the ACF plugin).
Another way to help users sort through all the info in your map is by including a Directory.
The Directory can be set off to the side and display a list of clickable Objects or Regions on the map. You’re also able to show Categories in the directory. It’s up to you which ones show up and in what order they’re displayed for easy searching.
Step 5: Optimize Map Performance
SVGs are, in general, much smaller in size than their JPG or PNG image counterparts. However, there are some things that can impact the size of your SVG file and what it does to your page speed.
If you’re not already in the habit of doing so, here are some things you can do to reduce your SVG file size as you’re creating it:
- Try to keep the canvas small. SVG is scalable, so it’s not as though you need to work with larger file sizes in order to create your map or graphic.
- Minimize the number of paths you use. When possible, opt for shapes.
- Before exporting the file, strip out unnecessary code and metadata.
- Also, if there is anything hidden in the file or that sits outside the canvas, remove it from the final file.
- If you can, shorten your HEX codes to three digits instead of six.
Here are some more tips and guidance on how to optimize SVGs for website performance when preparing your files.
Once your file is exported, there are additional tactics you can do to reduce the strain on your page loading speeds.
To start, enable caching. This way, if nothing has changed with regards to your map or anything else on the page, browsers can quickly serve the content up to visitors.
Also, apply lazy loading to any maps that appear below the fold. The easiest way to do this is to edit your map’s shortcode like this:
[mapsvg id="1" lazy="true"]This will defer the loading of your map until someone scrolls to that part of the page (if they scroll that far).
Lastly, by using MapSVG, you’ll have the added advantage of the map initialization code being generated on demand. This will keep your page sizes smaller.
Some performance plugins (e.g., WP Rocket, LiteSpeed Cache) may minify/defer scripts in ways that affect interactive maps.
We recommend excluding MapSVG assets from these optimizations (minify/deferral/preload) to avoid issues.
Step 6: Add the Map to Your Page
To add your map to a page or post, copy the shortcode. You’ll find it next to the name of your map in the top-left corner of the editor. The shortcode can also be found on the MapSVG dashboard.
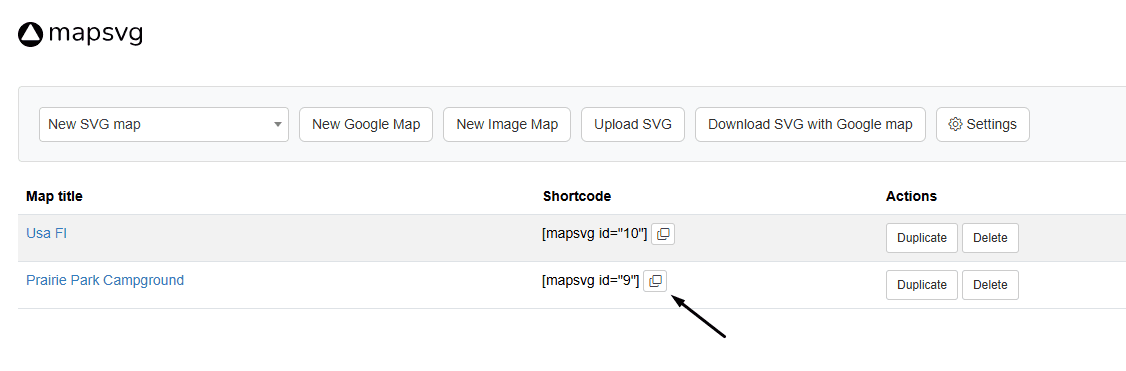
Click to copy the shortcode. Then go to your page, add a Shortcode block using WordPress, Elementor, or your block builder of choice, and paste the shortcode.
Save your changes and then preview your work. You’ll now be able to see and interact with the map as your visitors would.
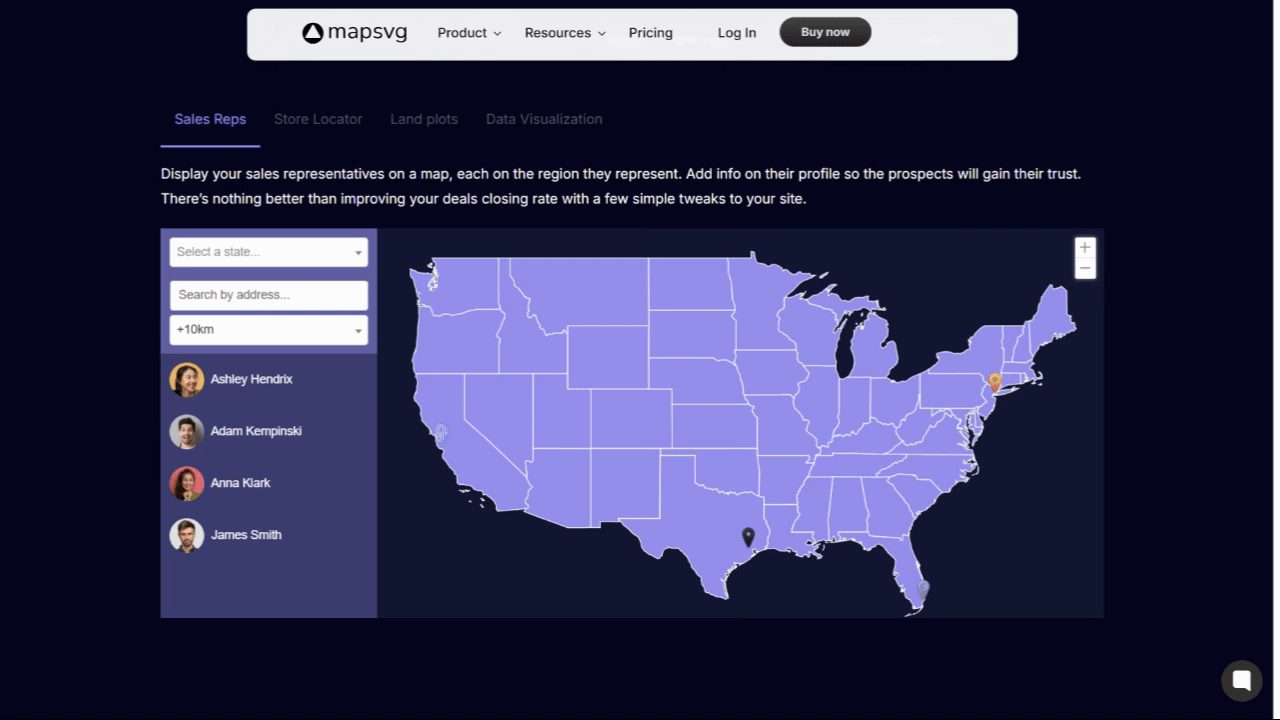
If there are hover- or click-triggered actions for Regions or Markers, test them out. In this demo from the MapSVG page you can see how the Directory on the left highlights the corresponding state for each agent. Clicking on the agent name then reveals a detailed Popover.
Make sure that the functionality you’ve enabled works exactly as you wanted it to. Then publish the page or post to your site.
Wrapping Up
There’s nothing wrong with using Google Maps on a website. There are plenty of use cases where Google’s mapping tool makes sense – like showing a zoomed-in map of your offices, providing premade directions to a location, or displaying custom locations.
But Google Maps doesn’t always fit the bill. What’s more, it also brings with it concerns about loading speeds, data privacy, feature limitation, and so on.
An SVG file on its own might not seem like a practical alternative. But an SVG file converted into an interactive map with MapSVG is.
With this WordPress plugin, you can customize your map with colors, details, and functionality you only dreamed of before.
Explore MapSVG for your next build (the Elite plan for developers is currently 33% off).