
I’ve lost count of how many times I’ve seen alert systems blow up my inbox for no real reason, a quick traffic spike, a minor lag, and suddenly it’s chaos. But when it actually breaks, you hear nothing. Most of these systems were designed years ago, for static servers and predictable loads, not the dynamic cloud environments we deal with today.
That’s when I started rethinking how alerting should really work. In this article, I will demonstrate how to build an event-driven alerting pipeline using AWS EventBridge and Lambda that reacts to real-time events.
Why Traditional Alerts Do Not Work
I’ve been on enough on-call rotations to know how bad old-school alerts can be.
- Email-only alerts: Get buried under a pile of noise. By the time you see them, the issue’s either gone or much worse.
- False positives: A little traffic surge and suddenly everyone’s getting paged.
- False negatives: Slow jobs that actually matter slip quietly through because the system only checks every few minutes.
- Integrations: Getting Slack or Jira to play nicely with these setups feels like duct-taping two different worlds together.
- Longer MTTR: Half the time goes into filtering out irrelevant alerts.
Most monitoring systems still operate on fixed polling intervals. They only check on a schedule, so by the time they notice something’s wrong, users would have already felt it.
Why EventBridge + Lambda?
EventBridge and Lambda together make it easy to build event-driven alerting systems that are both real-time and low maintenance.
- EventBridge acts as your intelligent event bus. It receives native AWS events or custom ones, filters them by JSON rules, retries on failures, and routes them to the correct targets (Lambda, SNS, Firehose, etc.).
- Lambda runs the routing, enrichment, and remediation code, and it can automatically scale up to handle thousands of events per second.
This setup processes events as they happen, supports selective filtering, and handles failures through retries or DLQs. Because billing is per invocation, the cost stays low even at scale.
Architecture Overview
Here’s the basic alerting flow:
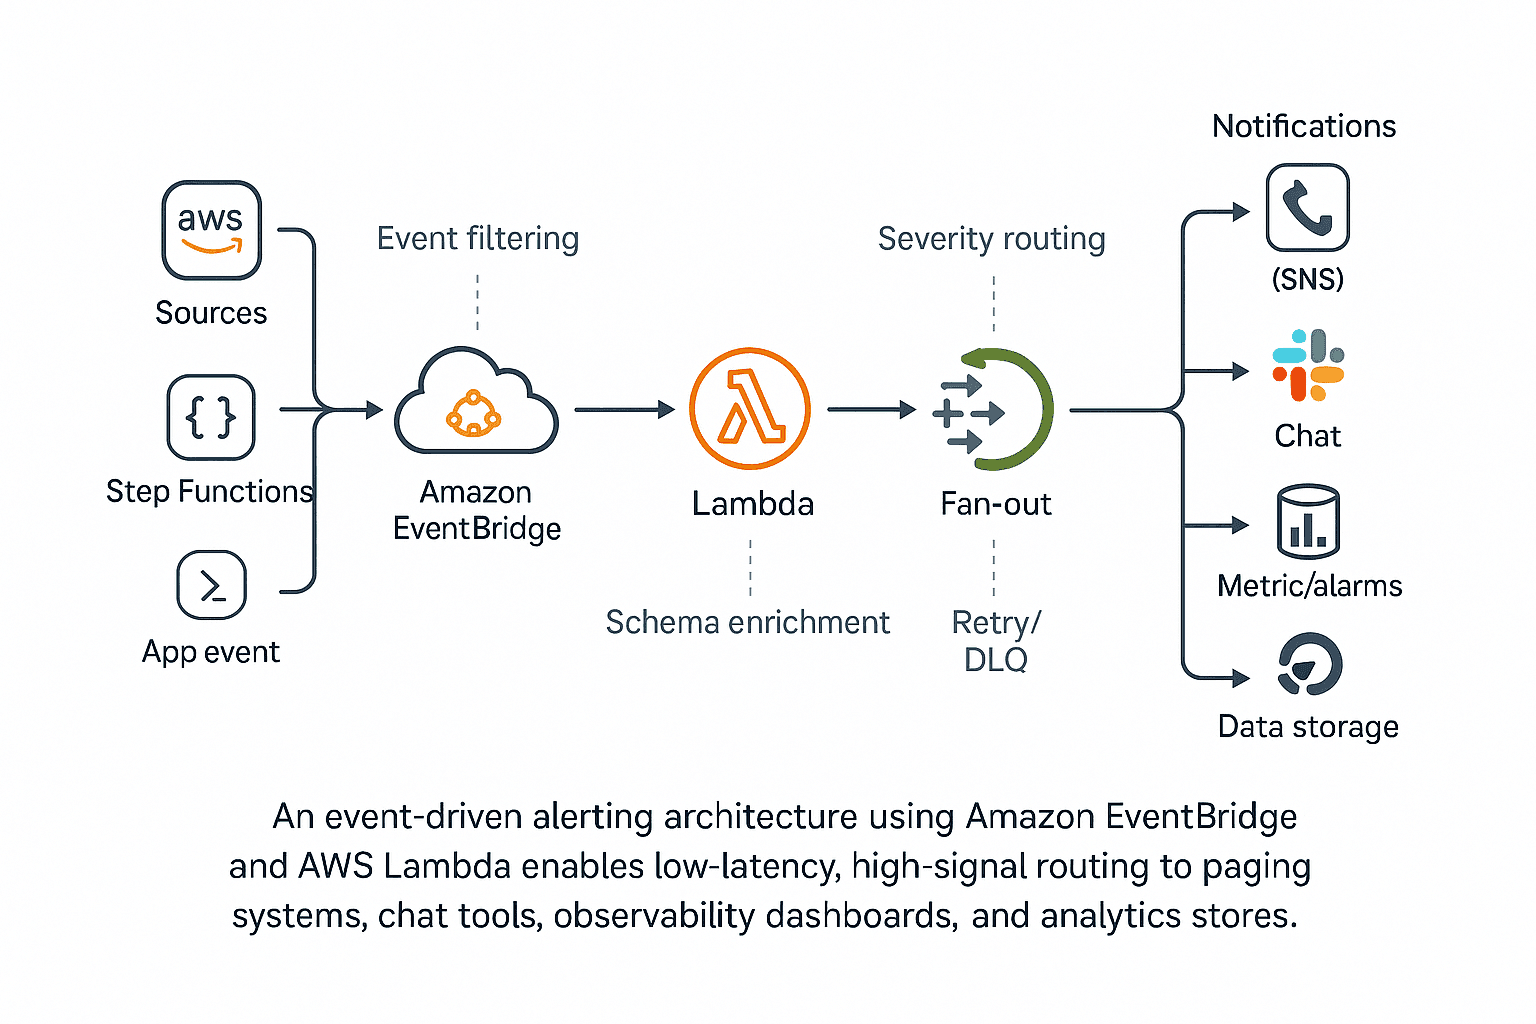
Sources
- Native AWS events (e.g., S3 object created, ECS task stopped, Step Functions failed).
- CloudWatch Alarms changing state.
- Custom application events sent via PutEvents or API destinations.
Processing
The Lambda checks the event structure first, then adds a few tags such as correlation ID, tenant, and severity. If it’s already seen the event ID or domain key, it skips it.
Fan-Out Actions
- Paging: For Sev 1 or Sev 2 incidents, trigger an SNS notification or open a ticket in the incident-management tool.
- Chat: Drop a quick message in Slack or Teams so people know what’s going on and can jump in fast.
- Observability: Ship the metrics to CloudWatch, and just throw the raw events into S3, making it a lot easier to dig through them later.
Enough theory — let’s build a simple alerting pipeline.
We’ll start with a straightforward event flow and add pieces as we go: routing, notifications, observability, and so on. The idea is to keep it minimal yet solid, something that actually runs in production and reduces alert noise.
Here’s how we’ll build it out, one step at a time:
- Set up an EventBridge rule that triggers when a real event occurs, such as an S3 upload.
- Add a Lambda function that checks the event, adds a few details, and routes alerts based on their severity.
- Hook up notifications: email for simple cases, chat or paging for the bigger ones.
- Store the metrics and raw events so you can build dashboards or check SLAs later.
- Run a few tests to make sure the whole thing catches failures and retries automatically.
Think of this as a basic starter setup. You can get it running in a day, and it’s easy to extend across accounts or tenants when you need to scale.
Step 1: Create an EventBridge Rule
Let’s begin with an EventBridge rule for S3 ObjectCreated events, filtered to the incoming/ prefix.
{
  "source": ["aws.s3"],
  "detail-type": ["Object Created"],
  "detail": {
    "bucket": {
      "name": ["vishal-alerts-bucket"]
    },
    "object": {
      "key": [{
        "prefix": "incoming/"
      }]
    }
  }
}
Target this rule to your Lambda function and attach an SQS DLQ to catch any undeliverable events.
Step 2: Let’s Write the Lambda
Below is a minimal, idempotent Lambda router written in Python.
It detects duplicates, enriches incoming events, then routes them by severity.
log = logging.getLogger()
log.setLevel(logging.INFO)

sns = boto3.client("sns")
ddb = boto3.client("dynamodb")

TOPIC_ARN = os.environ["ALERT_TOPIC_ARN"]
IDEM_TABLE = os.environ["IDEM_TABLE"]
IDEM_TTL_SECONDS = int(os.environ.get("IDEM_TTL_SECONDS", "21600"))  # 6h

def _now_epoch():
    return int(time.time())

def _ttl_epoch(seconds):
    return _now_epoch() + seconds

def is_duplicate(correlation_id: str) -> bool:
    # Conditional put; if item already exists, we know it's a duplicate.
    try:
        ddb.put_item(
            TableName=IDEM_TABLE,
            Item={
                "correlationId": {"S": correlation_id},
                "created_at": {"N": str(_now_epoch())},
                "expires_at": {"N": str(_ttl_epoch(IDEM_TTL_SECONDS))}
            },
            ConditionExpression="attribute_not_exists(correlationId)"
        )
        return False
    except ClientError as e:
        if e.response["Error"]["Code"] in ("ConditionalCheckFailedException",):
            return True
        raise

def derive_servity(evt_detail) -> str:
    # Example heuristic: derive severity from detail content if not provided
    src = evt_detail.get("bucket", {}).get("name", "")
    key = evt_detail.get("object", {}).get("key", "") or ""
    # example rules
    if key.startswith("incoming/critical/"):
        return "high"
    if key.endswith(".err") or key.endswith(".failed"):
        return "high"
    return "info"

def handler(event, context):
    # EventBridge envelope (single event per invoke)
    log.debug(json.dumps(event))
    eid = event.get("id")
    detail = event.get("detail") or {}
    sev = (detail.get("severity") or derive_servity(detail)).lower()
    tenant = detail.get("tenant") or "unknown"
    log.info(json.dumps({"received": True, "correlationId": eid, "severity": sev, "tenant": tenant}))

    # Correlation ID: prefer EventBridge event.id; else deterministic hash of detail
    correlation_id = eid or hashlib.md5(json.dumps(detail, sort_keys=True).encode()).hexdigest()

    if is_duplicate(correlation_id):
        log.info(json.dumps({"skipped": "duplicate", "correlationId": correlation_id}))
        return {"skipped": "duplicate"}

    msg = {
        "correlationId": correlation_id,
        "tenant": tenant,
        "severity": sev,
        "event": detail
    }

    # Emit EMF metric (DurationMs example if provided)
    if "job" in detail and "durationMs" in detail:
        log.info(json.dumps({
          "_aws": {
            "Timestamp": int(time.time() * 1000),
            "CloudWatchMetrics": [{
              "Namespace": "App/ETL",
              "Dimensions": [["job","tenant"]],
              "Metrics": [{"Name": "DurationMs", "Unit": "Milliseconds"}]
            }]
          },
          "job": detail["job"],
          "tenant": tenant,
          "DurationMs": float(detail["durationMs"])
        }))

    try:
        if sev in ("critical", "high", "sev1", "sev2"):
            sns.publish(
                TopicArn=TOPIC_ARN,
                Message=json.dumps(msg),
                Subject=f"[{tenant}] {sev.upper()} event"
            )
        # else: you could push to SQS/Firehose/Webhook here

        log.info(json.dumps({"ok": True, "correlationId": correlation_id}))
        return {"ok": True}
    except ClientError as e:
        log.error(json.dumps({"error": str(e), "correlationId": correlation_id}))
raiseTip: Implement is_duplicate() using DynamoDB with a short TTL or Redis to prevent re-alerting on the same event.
Step 3 — Routing alerts to the right channel
Each channel serves a purpose:
- Email: Good for daily summaries or low-priority heads-ups. If a few slip through the cracks, no big deal.
- Chat (Slack or Teams): Best for live triage. Drop in the correlation ID or a runbook link so folks can jump straight in.
- Paging: Keep this for the serious stuff, like only for Sev1 or Sev2.
Step 4: Persist Metrics and Events for Observability
CloudWatch Metrics (EMF)
You can use the Embedded Metrics Format (EMF) to log structured metrics directly from your Lambda.
Create alarms for:
- Error count
- Duration (P95 latency)
- Heartbeat metric (to detect silent failures)
Handle missing data as a breach. No data doesn’t mean no problem.
Stream Raw Events to S3
Use Firehose to persist raw events in S3 in Parquet format with partitions like:
dt=YYYY-MM-DD/tenant=acme/
Then crawl with AWS Glue to query via Athena, or visualize volumes and error rates in QuickSight.
For faster lookups, mirror hot fields (such as tenant, severity) into OpenSearch.
SLA Heartbeat Checker (DynamoDB + Scheduler)
Store a heartbeat record for every job, which can be like this:
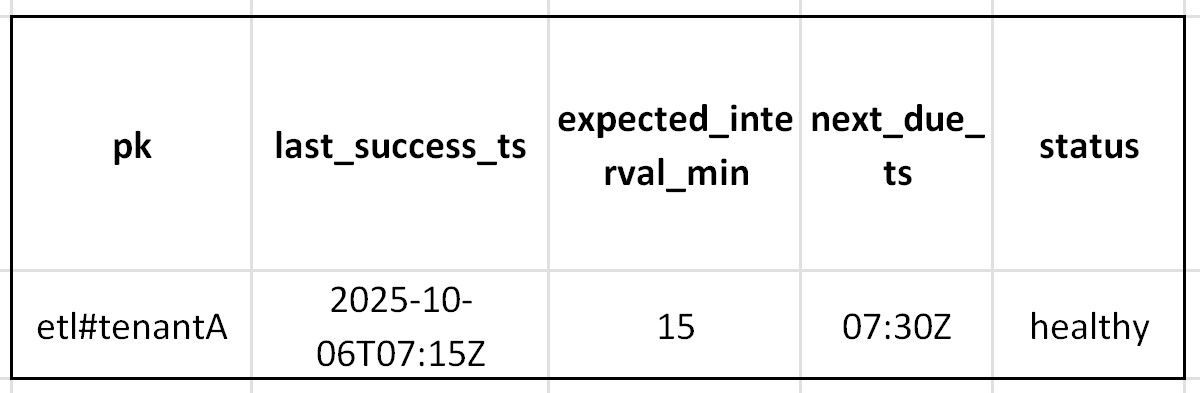
An EventBridge Scheduler runs every few minutes, triggering a Lambda that checks overdue jobs and sends a single consolidated alert when an SLA is missed.
Step 5: Test, Drill, and Deploy
Before you ship, break a few things first.
- Fire off some fake S3 events and trace the correlationId from start to finish.
- Kill a target on purpose. Make sure EventBridge and the Lambda DLQ both catch what doesn’t go through.
- Push the deploy through CI/CD, don’t forget the EventBridge rules, IAM policies, and the Lambda package itself.
- Add alarms for DLQ growth or error metrics.
- Run “fire drills” periodically. The best time to test your alerting pipeline is before an outage.
How to Scale Things Up
Once the base setup’s ready, you can start adding a few extras:
- Anomaly detection: Hook up SageMaker’s Random Cut Forest to catch weird spikes in run time or error rate. It saves you from hand-tuning thresholds every week.
- Workflow telemetry: Have each stage (ingest, transform, load) send an event. Fire an alert if one of them never passes control to the next.
- Cross-account setup: Point several AWS accounts at one shared EventBridge bus so all of them drop alerts into the same pipeline. Makes it easier to manage and see everything in one place.
- Multi-tenant scaling: Give each tenant its own bus and DLQ. That way, one tenant’s noise or bad data doesn’t spill into another’s dashboard.
- Cost controls: Filter or sample low-priority events at the bus level, and move older data to Glacier before storage costs creep up.
Lessons Learned
After multiple iterations, a few things stood out:
What Worked
- A three-layer design (metrics, raw events, heartbeat) catches most issues early.
- Treat missing data as an alert condition.
- Consolidate alerts into threads or incidents.
What Didn’t
- Relying solely on email alerts, you may find yourself digging through tons of irrelevant emails just to find the one that is relevant.
- Over-paging creates constant noise and dulls the urgency when something critical actually breaks.
- Ignoring DLQ health, unprocessed events quietly pile up.
Security and Compliance Notes
Keep your event system secure and compliant:
- Enforce least-privilege IAM on EventBridge, Lambda, SNS, and other services.
- Use KMS for encryption (EventBridge, S3, DynamoDB).
- Store tokens for chat and ticketing integrations in AWS Secrets Manager, not environment variables.
- Avoid sending PII to chat or logs, only what’s needed for debugging.
Conclusion: A Simpler, Smarter Alerting Backbone
With EventBridge and Lambda, you can build an alerting setup that reacts quickly, scales when necessary, and remains quiet the rest of the time.
Start small:
- One flow like S3 → EventBridge → Lambda → SNS
- Add metrics and heartbeats.
- Layer in dashboards, anomaly detection, and cross-account routing as you grow
Event-driven alerting isn’t a ‘nice-to-have’ feature. It gives teams a heads-up before users ever notice something’s wrong.
References
[1] https://docs.aws.amazon.com/eventbridge/latest/userguide/eb-what-is.html
[2] https://docs.aws.amazon.com/lambda/latest/dg/welcome.html
[3] https://docs.aws.amazon.com/eventbridge/latest/userguide/eb-what-is.html
[4] https://docs.aws.amazon.com/lambda/latest/dg/invocation-async.html#dlq